|
|
``More than a 3D ontology visualizationtool''
This document contains a simple user guide for the 3D viewer provided with Ontosphere3D. The visualization tool is composed by a set of panels: the main one hosts the 3D scene while the others allows for complementary tasks. An option panel provides a certain degree of scene personalization, in terms of sizes of graphical components, distances between them and colors; another one provides a simplified views for class herarchies and finally a proper panel allows to define, save and load subject areas.
The 3D main panel is detailed in the following sections: User Interface, Scene Managers and Logical Layers.
The OntoSphere3D user interface is quite simple, mouse centred, and supports scene manipulation through rotation, panning and zoom. Ontology elements are represented as follows: concepts are shown as spheres, instances are depicted as cubes, literals are rendered as cylinders and the relationships between entities are symbolized by arrowed lines where the arrow itself is constituded by a cone.
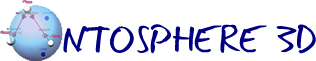
Concepts and instances within scenes are click-able with the following outcomes:
When between 2 concepts in a scene occour more than a single relation, no explicit label is provided and the cone is depicted in withe and left clicking onto it lists such relations.
In order to achieve its visualization goals OntoSphere3D exploits different scene managers that present and organize the information on the screen, each one according to a differently detailed perspective. The idea behind this solution is that different tasks demand different amounts of information and different presentations emphasizing certain features of data and omitting the others. Scenes interchange in managing the graphical space as user attention shifts from one concept to another, being the attention focus implicitly inferred from users interaction with the scene.
|
Main Scene
|
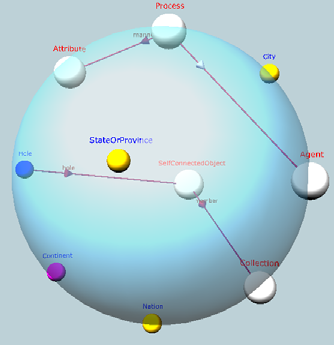
This perspective presents a big “earth-like” sphere bearing on its surface a collection of concepts represented as small spheres. The scene does not visualize any taxonomic information and only shows direct “semantic” relationships between elements of the scene, usually a graph not fully connected. Atomic nodes, the ones without any subclass, are smaller and depicted in blue while the others are white and their size is proportional to the number of elements con-tained in their own sub-tree. The main scene, was originally meant only to represent the ontology primitives (i.e. the root concepts) but now has been extended for supporting the definition of so-called logical views |
|
Exploring Taxonomy Branches
|
This scene shows the sub-tree originating from a concept; it displays the Is-A hierarchy as well as other semantic relations between represented classes. Since use evidence proves that too many elements on the screen at the same time, hinder user attention, the scene completely presents only three fully-expanded levels at a time. While the user browses the tree, the system automatically performs expansion and collapsing operations in order to maintain a reasonable scene complexity. Collapsed elements are colored in white and their size is proportional to the number of elements present in their sub-tree. Concepts located at the same depth level within the tree have the same color in order to easily spot groups of siblings. Is-a relations are displayed with a neutral color (gray) and without label, whereas other semantic relations involving two concepts already in the scene are displayed in red, accompanied by the name of the relation. If an element of the tree is related to a node not present on the scene, a small sphere is added for that node in the proximity of the given element, so terminating the end of the arrow: in such cases, incoming relations are represented with a green arrow, while outgoing links with a red one. |
|
Detailing on a Concept
|
In this scene, all the available information about a single concept is provided, at the highest possible level of detail. The concept’s children and parent(s) are therefore shown as well as its ancestor root(s) and its semantic relations, including the inherited ones. Semantic relations are drawn as arrows terminating in a small sphere: red if the relation is outgoing and green otherwise. Direct relations are drawn close to the concept, with an opaque color, while inherited ones are located a bit farther from the center and depicted with a fairly transparent color. DataType relations terminate in a blue cylinder.
|
|
Inspecting Instances
|
Whenever a concept has direct instances (in the tree focus scene or in the concept focus scene) its sphere is depicted surrounded by a translucent sphere, similar to a shell. Direct instances, as well the whole set of instances within the sub-tree originating from the concept, can be visualized by rightclicking on this shell-surrounded concepts. Navigation of instances can be done using two scenes: the first, reachable through the right-click on shell-surrounded concepts, mimics the main scene visualization representing instances as cubes on a sphere. White instances are related with other instances by means of so-called facts (relations between instances) while blue ones are isolated entities. The second scene can be reached by clicking on white instances. In such a case the graph of facts related to a given instance is shown and the adopted visualization strategy is the same of the Concept Focus Scene, representing related instances as a interconnected cubes. Facts are drawn as arrows, red if the relation is outgoing and green otherwise. |
Ontology designers frequently deal with “subject areas",
expecially when dealing with large ontologies where the knowledge
engineer only models limited subsets of the ontology at a time.
However Logical views are not commonly supported by ontology editing tools.
Ontosphere3D aims at providing an explicit support for visualizing and modelling subsets of a given knowledge domain. In order to offer a flexible and useful instrument to ontology designers, the tool supports user-definable subject areas that Allow to focus on specific areas of the knowledge model not related by structural proximity but by logical characteristics.
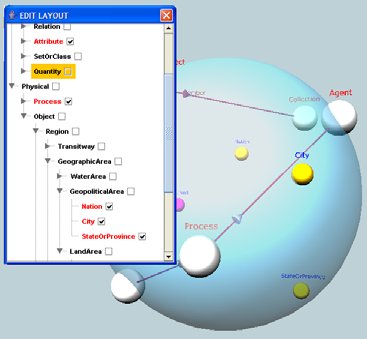
Subject areas are stored inside the ontology model in form of annotation properties and graphically represented using the Main view. They encompass subsets of the ontology concepts satisfying some selection criteria and the relations between them. Selection criteria basically assign to ontology elements a boolean membership to a given subject area either by evaluating arbitrarily complex logical expressions or by means of a simple, item by item, selection of the components.
Knowledge engineers can define logical views simply by interacting with the 3D ontology representation by means of contextual menus. Alternatively users can also perform the selection by a proper panel either using a simple tree-based representation or directly writing SPARQL queries. The panel can be used to load/save subject views from/to the ontology model.